We know who won in the World Jigsaw Puzzle Championship 2025, but what else can the results tell us? In this series of articles I will dive into different stats that can be pulled out from the data. This first part concentrates on the number of competitors in the competition this year and over the history of the championship, and how different countries did this year. I also briefly talk about mixed pairs and teams.
In the second part I will look into how well new and returning competitors did, and who improved their results the most from round to round and from last year. In the third part I will revisit the Play-off rule and what actually happened with it at Worlds.
How many actually competed?
Before Worlds many keep an eye on the participants list which shows how many people have signed up for the competition. Now after the championship we can also see how many actually competed. How this is done is by counting how many competitors are listed in the results for all first round groups in any given category.
This year the number of competitors ended up just under 1000 in individual category, bit over
Many perceptive competitors and spectators had noticed that in this years participant list there were many individuals, pairs and teams even when the competition started. People who had signed in to the website could tell that all the participants who had not been assigned to groups were ones who didn’t have the marker indicating they had paid. So it seems there was and is still a notable number of people who had decided not to go after all listed as participants.
It is not unusual that there is a number of participate for will not show up to the competition despite signing up. This has happened every year to an extent. However, it feels unusual to keep a large number of people who have never finalised their sign up process on the list too.
In the table below I have compared the numbers of participants listed (including those who had not paid), participants assigned to groups, and participants who actually competed aka have result recorded in in the first round.
| Individual | Pairs | Teams | |
|---|---|---|---|
| Participants listed | 1154 | 731 | 297 |
| Participants assigned to groups | 1054 | 689 | 289 |
| Participants who competed | 997 | 651 | 287 |
| Participants listed vs. participants who competed | -157 (-13,6%) | -80 (-10,9%) | -22 (-3,4%) |
| Participants assigned to groups vs. participants who competed | -57 (-5,4%) | -38 (-5,5%) | -2 (-0,7%) |
The drop from participants listed to who competed is quite significant, especially in individual category. On the other hand, when we look just those who were actually assigned to groups the drop is quite a bit more moderate. It is also relatively well in line with the portion that has not showed up in previous years. Below you can see two charts showing first the number of not competing participants in both absolute numbers and as percentages.


Especially the percentages show that if we only look at the participants assigned to groups, this year is relatively well in line with the previous years. If we compare the percentage of people from the full participant list who didn’t compete, this year looks bit more like an outlier but not outrageously so.
It is also good to note that the extreme heat in the Millenium Dome this year may have caused some competitors to drop out of the competition on at the last minute, which would also be reflected in these numbers.
Fewer competitors than in 2024
When we look at the number of participants who actually competed aka had a result recorded and compare it to 2024, it turns out the number of competitors has dropped slightly. 2025 had approximately 10% less competitors in both individual and pairs categories. Also teams saw a drop but it was a much smaller one. You can see the precise numbers below.
| Category | Competed in 2024 | Competed in 2025 | Difference | % |
|---|---|---|---|---|
| Individual | 1106 | 997 | -109 | -9,9 % |
| Pairs | 721 | 651 | -70 | -9,7 % |
| Teams | 300 | 287 | -13 | -4,3 % |
To get a wider perspective on the development of number of competitors, we can also at how the numbers have changed since the first WJPC. In the chart below you can see the development of year over year.

For few years the growth of the championship was very fast. In both 2023 and 2024 the number of competitors approximately doubled in every category. Now that growth has clearly stopped at least for now as 2025 the number of competitors decreased. Below you can see the development each year compared to the previous championship.

Seeing the drastic change in development does race the question: Why is that? This question seems prevalent as the enthusiasm towards the sport does not seem to be decreasing globally but rather more and more people have found it. At this moment at least there is no definite answer to the question. However, at least anecdotally some people (me included) have stated that the championship staying in the same place year after year has made them less interested to return.
Most successful countries
We often compare individual competitors and their success in a competition but how about different countries? I decided to see which countries got the highest number of competitors to the final in individual category, as well as which countries got the highest portion of their competitors to the final.
Top 5 countries with most competitors in the final:
- Germany – 28
- USA – 16
- Poland & France – 12
- –
- The Netherlands & Sweden – 11
Germany is no surprise at the top of the first list as it had most competitors in the competition overall. USA had 3rd most competitors. Also the other 4 countries listed above are in the top 10 of countries with most competitors. Very notably Spain, which had second most competitors in the competition, is not on this list, but they were just outside it with 10 competitors in the final.
Top 5 countries with highest portion of their competitors in the final:
- Malaysia – 75,0% (3/4 competitors)
- Slovenia – 42,9% (3/7)
- Poland – 38,7% (12/31)
- Czech Republic & Switzerland – 33,3% (7/21 & 5/15)
- –
With the proportional representation Malaysia was ways above anyone else, which is impressive even with their relatively low number or competitors. Only approximately 18% of all competitors made it to the final. This list also shows well why Poland is talked as a powerhouse of speed puzzling as they managed to reach the top 3 in both number of competitors and in proportional representation in the individual final.
28 out of the 59 countries that had competitors in the first round of the competition, did not get any competitors through to the final. Below you can see how countries did in different stages of the competition. Note that countries with under 10 competitors in the first round have all been grouped together.

Europe vs. the world
Considering that the WJPC has yet to be arranged on any other continent than Europe and as the availability of many of the Ravensburger puzzles is generally better in Europe, many do wonder how the results of Europeans and competitors from outside Europe compare to each other. The question most often asked is “Do Europeans benefit from the first round being published puzzles.
Like with new and returning competitors, I did a comparison of the number of Europeans and non-Europeans in the different stages of the competition. The chart below goes from the list of participants all the way to the final. I’ve done this only with the individual category.
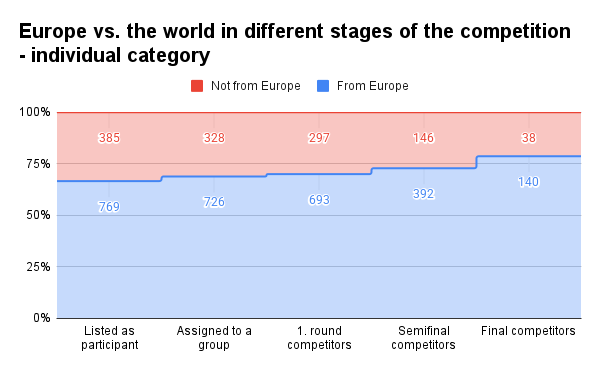
Not surprisingly there was more Europeans in the competition from the start. In the list of participants 2/3 of competitors are from Europe and it goes up to a 70% – 30 % split when we look at the first round competitors. More Europeans advance from to the semifinal, but not with a huge margin – the split goes to 73% – 27%. It is notable that Europeans do advance also to the final with a higher percentage, despite all the puzzles being unpublished, and the split in the final is 79% – 21%.
Another way to compare how well each group is to look at the average and median placements in different rounds. Below you can see a table showing the averages and medians for both Europeans and non-Europeans. Very notably Europeans had higher average and median placement in first round and semifinals but the non-Europeans did much better on average in the final. In general the development of the average and median placements is opposite for these groups.
| Placement | Europeans | Non-Europeans |
|---|---|---|
| 1. round average | 79 | 96 |
| 1. round median | 77 | 100 |
| Semifinal average | 86 | 98 |
| Semifinal median | 88 | 99 |
| Final average | 92 | 87 |
| Final median | 95 | 78 |
Mixed pairs and teams
This year we had a new rule that stated that pairs and teams with several nationalities would not be competing under a national flag but under the WJPC flag. Because of this many have expressed interest in reading about how these mixed pairs and teams faired compared to the other teams.
I would have liked to write about this too, but unfortunately the data about mixed pairs and teams on the WJPC website is not consistent. What I mean is there are many pairs and teams that fall under the definition of mixed, but were not marked as such in the participants list or in the results. There is also inconsistency between participant list and results and even in the results for different rounds.
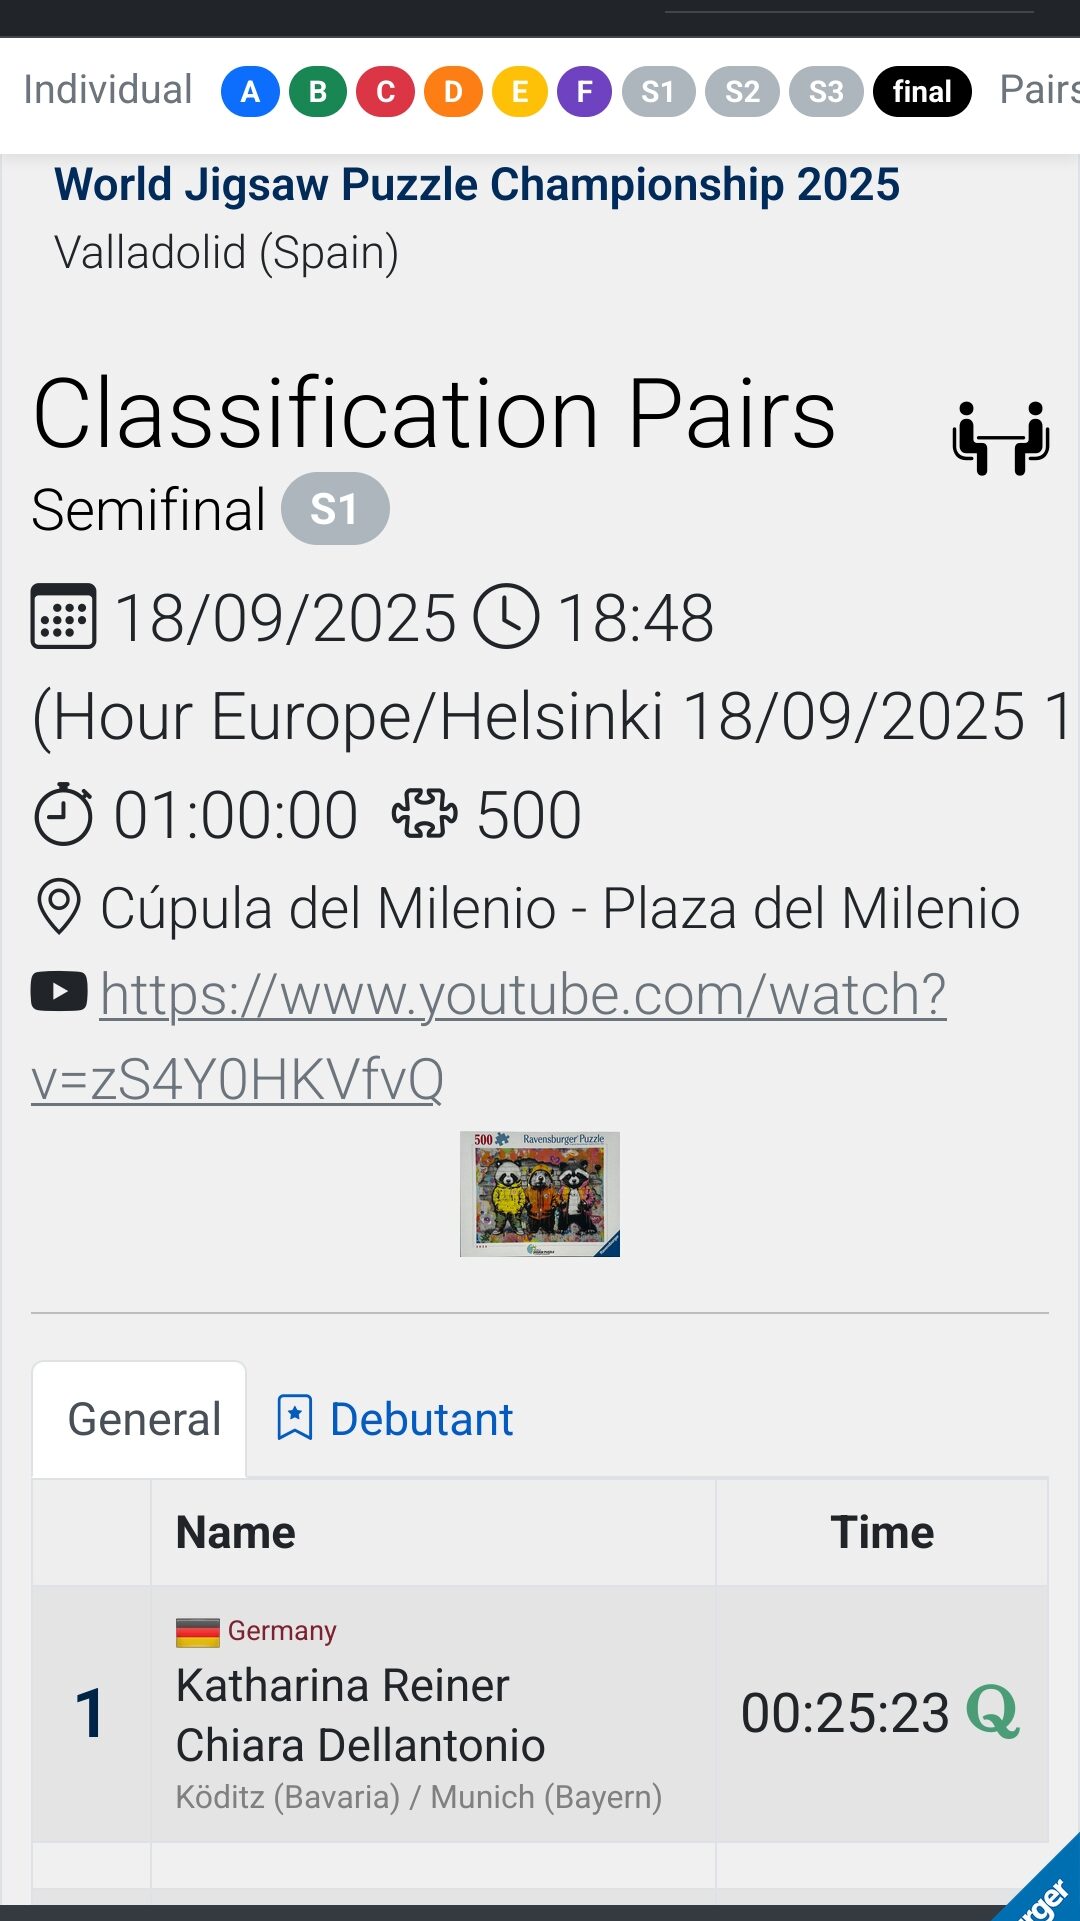
One very notable example of this are Katharina Reiner and Chiara Delantonio, who placed second in pairs category. They were marked representatives of Germany in the participants list, first round results and semifinal results, but in the final they are marked as a mixed pair. You can see screenshots of them in the participants list and results below. I have found also several other pairs with similar inconsistencies in the nationality listed.



Because of these inconsistencies in the data, I have decided to leave pairs and teams out of the parts of analysis that involve nationality of competitors in any way.
The question of who is allowed to represent which country and on what bases is a complicated and nuanced one, especially when considering immigration and dual citizenships. It is not a question I’m going to dive in now in this article, but we are planning on writing about it later on.
Sources and other useful links:
Comments
3 responses to “What the WJPC results tell us – part 1: Competitors and countries”
Really lovely to read. A really big dive into the numbers. I really would like to see the number of participation for next year to see if the lower numbers this year was just once. I still believe the community is growing.
Did I see correctly that only about 1/3rd of participants were returning? If a company would show these numbers, that would raise red flags all over, but I guess for an annual competition in the same city every year it’s fair to say this is no surprise. Taking a week off to travel to the same location again might be something not many are interested in, especially if you’re not part of a community. More activities outside the dome would probably combat this a little bit.
I will be talking about the number of new versus returning competitors in the next part of the series so stay tuned.